Jean-Julien Fleck’s contribution
Most of the plots present in this gallery have been produced for my PhD and thus labelled in french, using mostly CTioga to pilot Tioga.
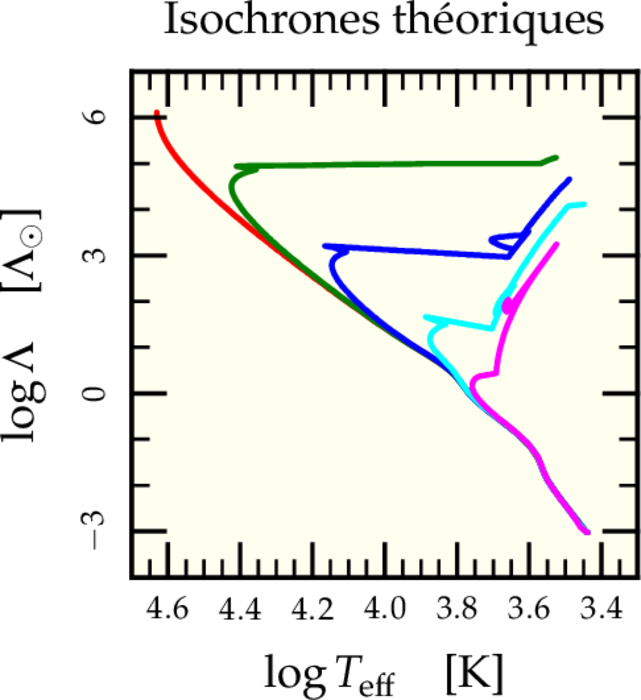
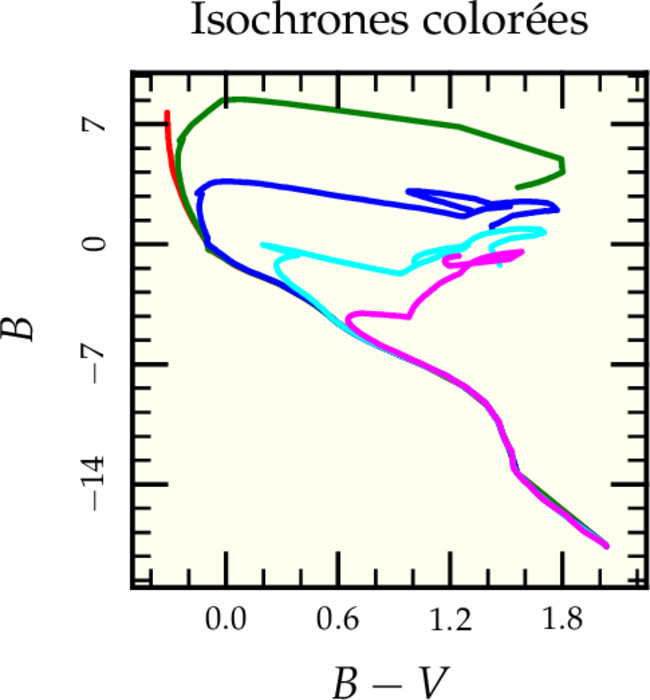
First some stellar evolution plots of theoretical and “observational” isochronal Herzsprung-Russel diagrams
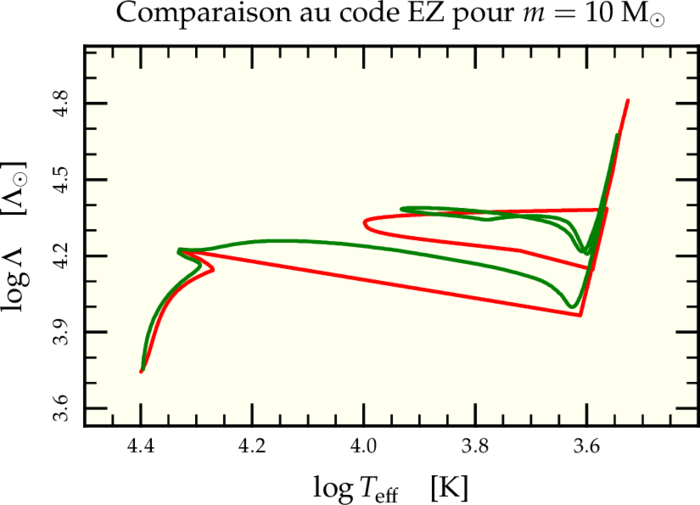
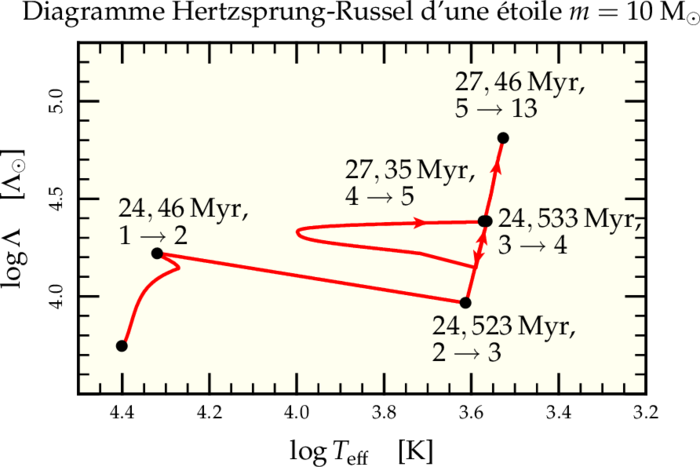
Then a comparizon of the evolution of a 10 solar masses stars from stellar evolution fitting formulae and Bill’s EZ stellar evolution code
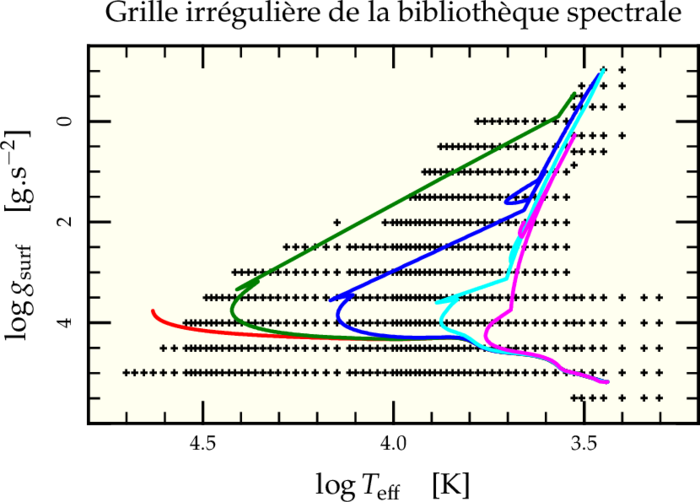
The way those isochrones fits into the spectral library I use
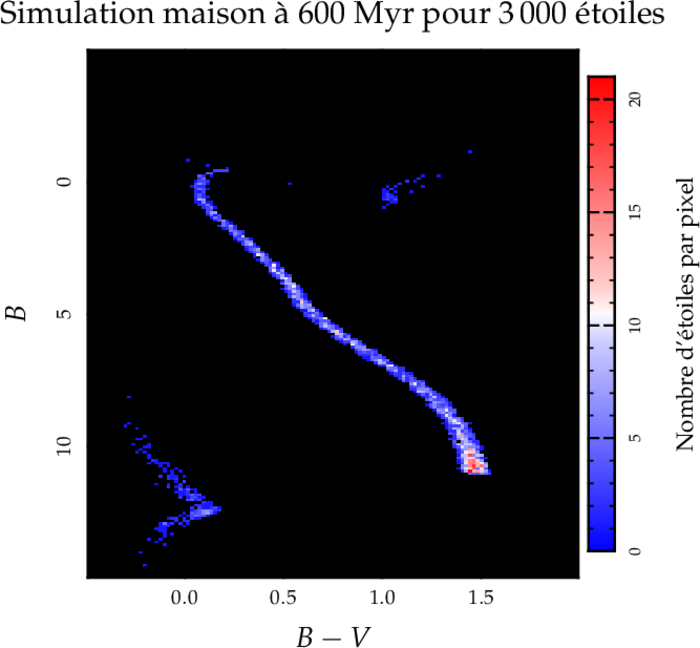
A 600Myr old cluster simulated with this library. This one is a pure Tioga plot inspired by the Contours plot presented in samples/plots/plots.rb
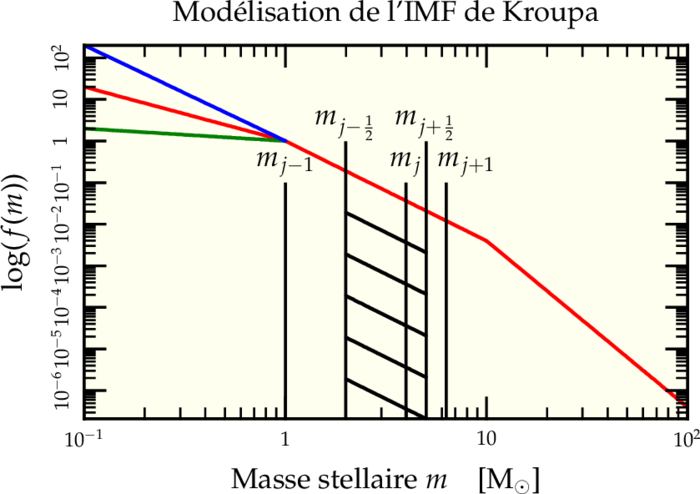
Now we define the stellar initial mass function in log scales
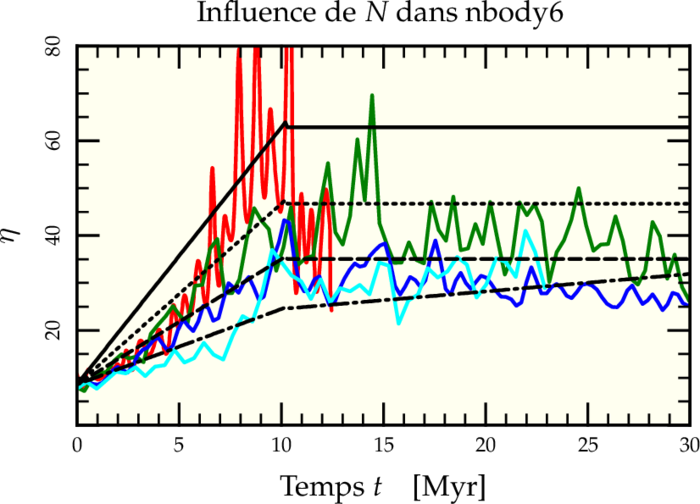
Influence of some parameter on an important factor (in my PhD) together with pseudo-analytic predictions
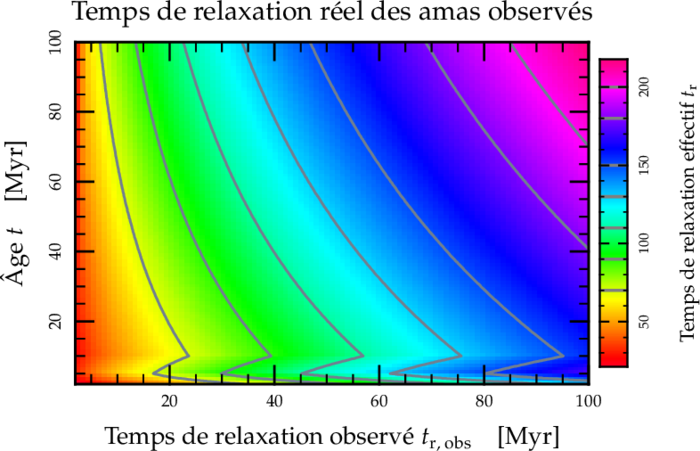
“Real” relaxation time as a function of age and observed relaxation time. Here again, this Tioga plot is inspired from the Contours plot of samples/plots/plots.rb
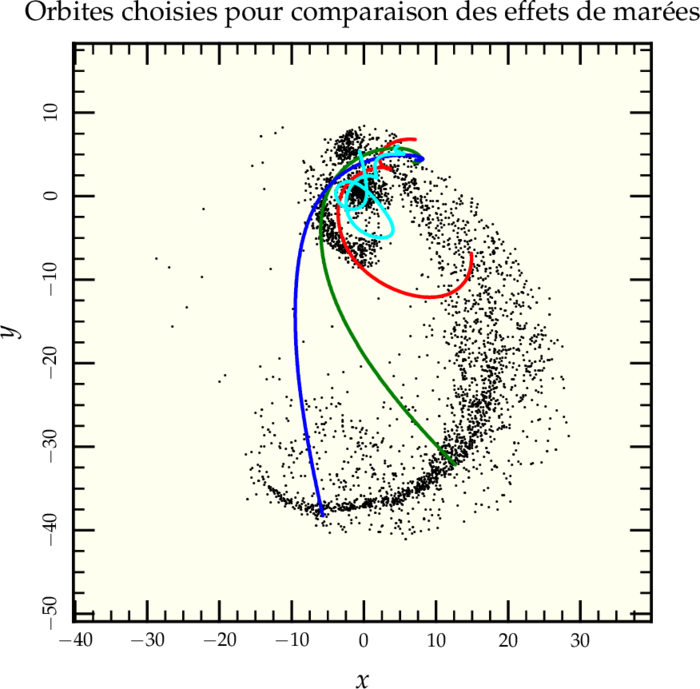
Some orbits in a simulation representing the Antennae system
And that’s all for now!
