module Tioga::Tutorial::SimpleFigure
A first look at a nontrivial tioga figure definition¶ ↑
In the samples/figures directory, enter this to the shell to make a pdf show it in your viewer.
tioga figures -s 'Curve'
This is what you should see.
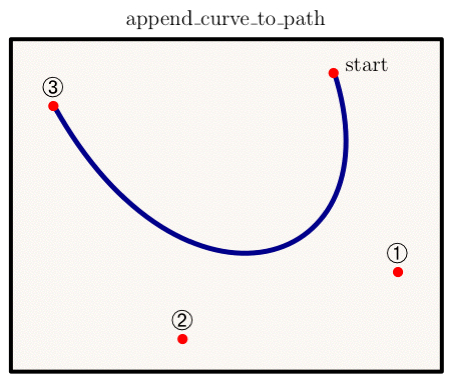
In the source file, the definition looks like this (with line numbers added for this tutorial only):
 1  def curve
 2      t.landscape
 3      t.show_text('text' => 'append\_curve\_to\_path',
           'side' => TOP, 'shift' => 0.6,
           'justification' => CENTERED,
           'scale' => 0.9, 'position' => 0.5)
 4      background
 5      x0 = 0.75; y0 = 0.9
 6      x1 = 0.9; y1 = 0.3
 7      x2 = 0.4; y2 = 0.1
 8      x3 = 0.1; y3 = 0.8
 9      t.move_to_point(x0, y0)
10      t.append_curve_to_path(x1, y1, x2, y2, x3, y3)
11      t.line_width = 2.5
12      t.line_color = DarkBlue
13      t.stroke
14      t.show_marker(
            'xs' => [ x0, x1, x2, x3 ],
            'ys' => [ y0, y1, y2, y3 ],
            'marker' => Bullet,
            'scale' => 0.6,
            'color' => Red);
15      dx = t.default_text_height_dx * 1.4
16      t.show_label('x' => x0+dx, 'y' => y0,
            'text' => "start", 'scale' => 0.9);
17      scale = 1.2; dy = t.default_text_height_dy * 0.8
18      t.show_marker(
            'at' => [x1, y1+dy],
            'marker' => Circled1, 'scale' => scale);
19      t.show_marker(
            'at' => [x2, y2+dy],
            'marker' => Circled2, 'scale' => scale);
20      t.show_marker(
            'at' => [x3, y3+dy],
            'marker' => Circled3, 'scale' => scale);
21  end
Everything that starts with “t.” is directed at the FigureMaker. The other things are either local methods or local variables. The code starts by changing the aspect ratio to landscape. Then it puts the text at the top using “show_text”. Notice the backslashes before the underscores. They are needed to keep TeX happy since the text will be sent to TeX for typesetting. The call on “background” invokes one of our own methods to fill in the background and put a line around the frame. The control points for the Bezier curve are stored in local variables in lines 5 to 8, and the curve is added to the graphics path in lines 9 and 10. After setting the line width and color, it is painted by “t.stroke” in line 13. The first call to “show_marker” (line 14) takes care of the four red bullets at the control points. The text label is placed at point (x0,y0) by the call on “t.show_label” in line 16. Finally, the numbers inside circles are painted by the calls on “t.show_marker” to finish things off (lines 18-20).
- What's a “marker”? Visit MarkerConstants to find out and to see lots of examples.